

EconMOD
Infinite-Sum Consulting · Infinite-Sum Modeling
A quantitative economic analysis workbench — aggregation, closure, shocks, and general-equilibrium solving for GTAP / CGE, all in the browser.

In one sentence
Policy scenarios and trade shocks shouldn’t be held hostage by local toolchains, hand-maintained directories, and scripts that can’t be reproduced.
EconMOD folds regional/sectoral aggregation, closure and shock specification, and general-equilibrium solving into a single auditable, collaborative server-side workflow.
Why it matters
In applied CGE / GTAP work, the real bottleneck is rarely “we can’t write the equations” — it’s:
- Dimension governance — from the global base data to an interpretable region-by-sector mapping, every step has to be checkable;
- Scenario engineering — closures (Book / Short / Long / Self) and shock variables must be aligned before submission, not guessed at after the solve fails;
- Compute and collaboration — the heavy lifting should queue and run on a server, with results deposited in structured form, not scattered across personal disks as intermediate files;
- Numerical credibility — key gates (aggregation accuracy, reference-scenario welfare EV, etc.) must be repeatedly verifiable by the team.
EconMOD is built for exactly this chain — not another dashboard, but a runnable modeling workbench.
The core pipeline
From the licensed base data to searchable results, the product path is explicit:
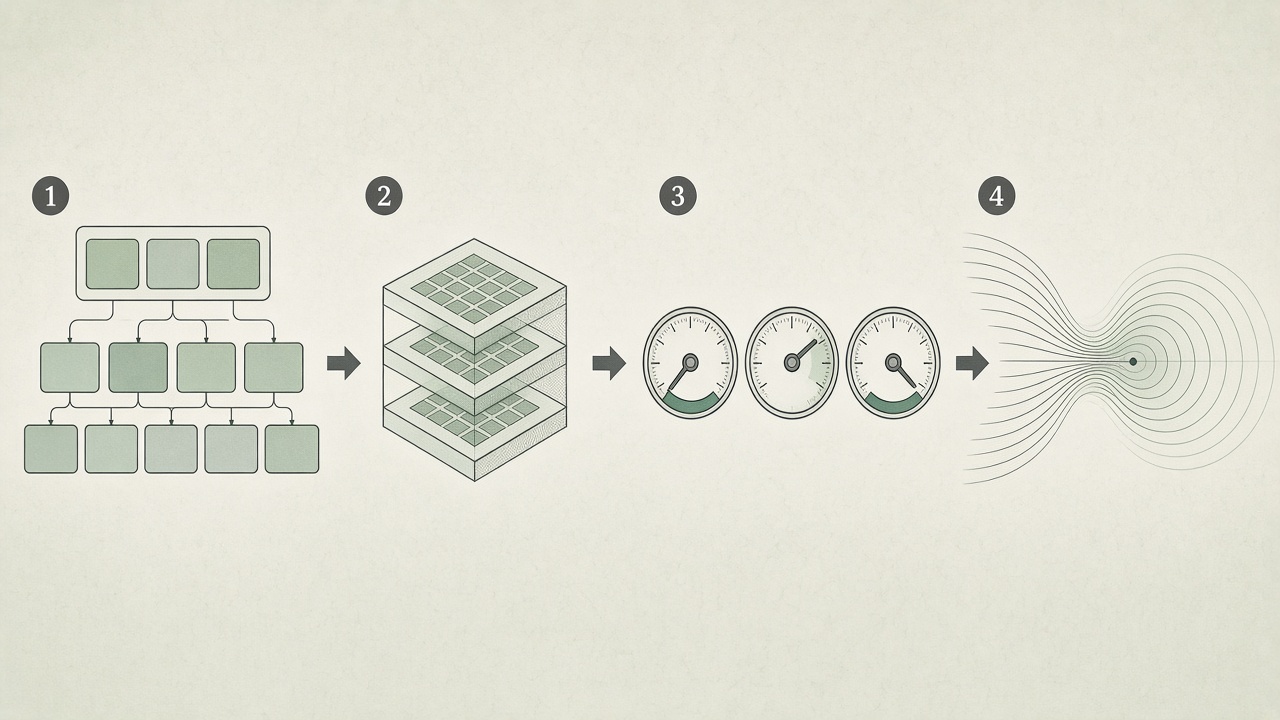
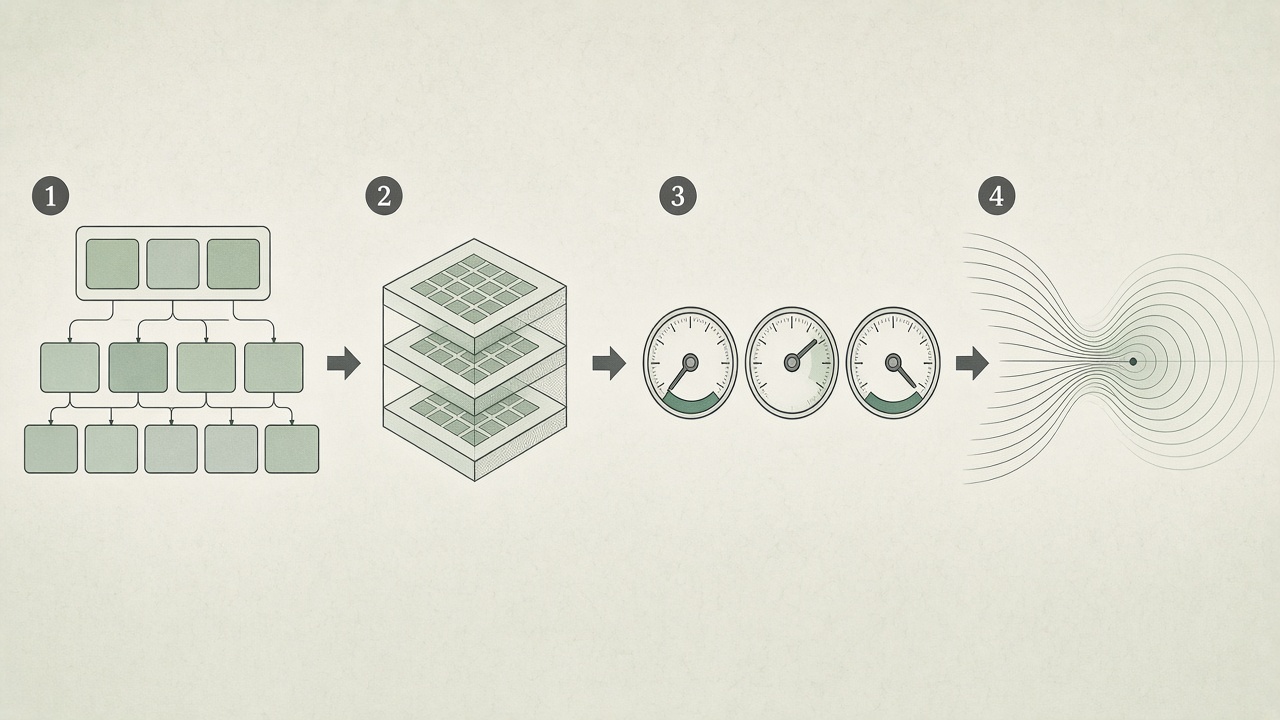
Aggregation mapping → Build aggregated library → New simulation on a library → Solve
| Stage | What you do | What the system delivers |
|---|---|---|
| Aggregate | Define region / sector groups and mappings (standard templates included) | A derived aggregated library, owned by your own workspace |
| Simulate | Pick a closure preset, solve method and step size; edit shocks in structured form | A submittable scenario (with exogeneity and shock-consistency pre-checks) |
| Solve & results | Jobs queue on the server; browse EV, macro and variable slices | Job logs + complete solution results, exportable for comparison |
Base libraries are published and licensed by administrators; personal derived libraries belong only to you — ideal for consulting projects and research teams working in parallel without cross-contamination.
Key modules (real interfaces)
All screenshots below are from the live EconMOD workbench.
Sign-in
Log in with your assigned account to enter the workspace; the UI supports Chinese / English switching.

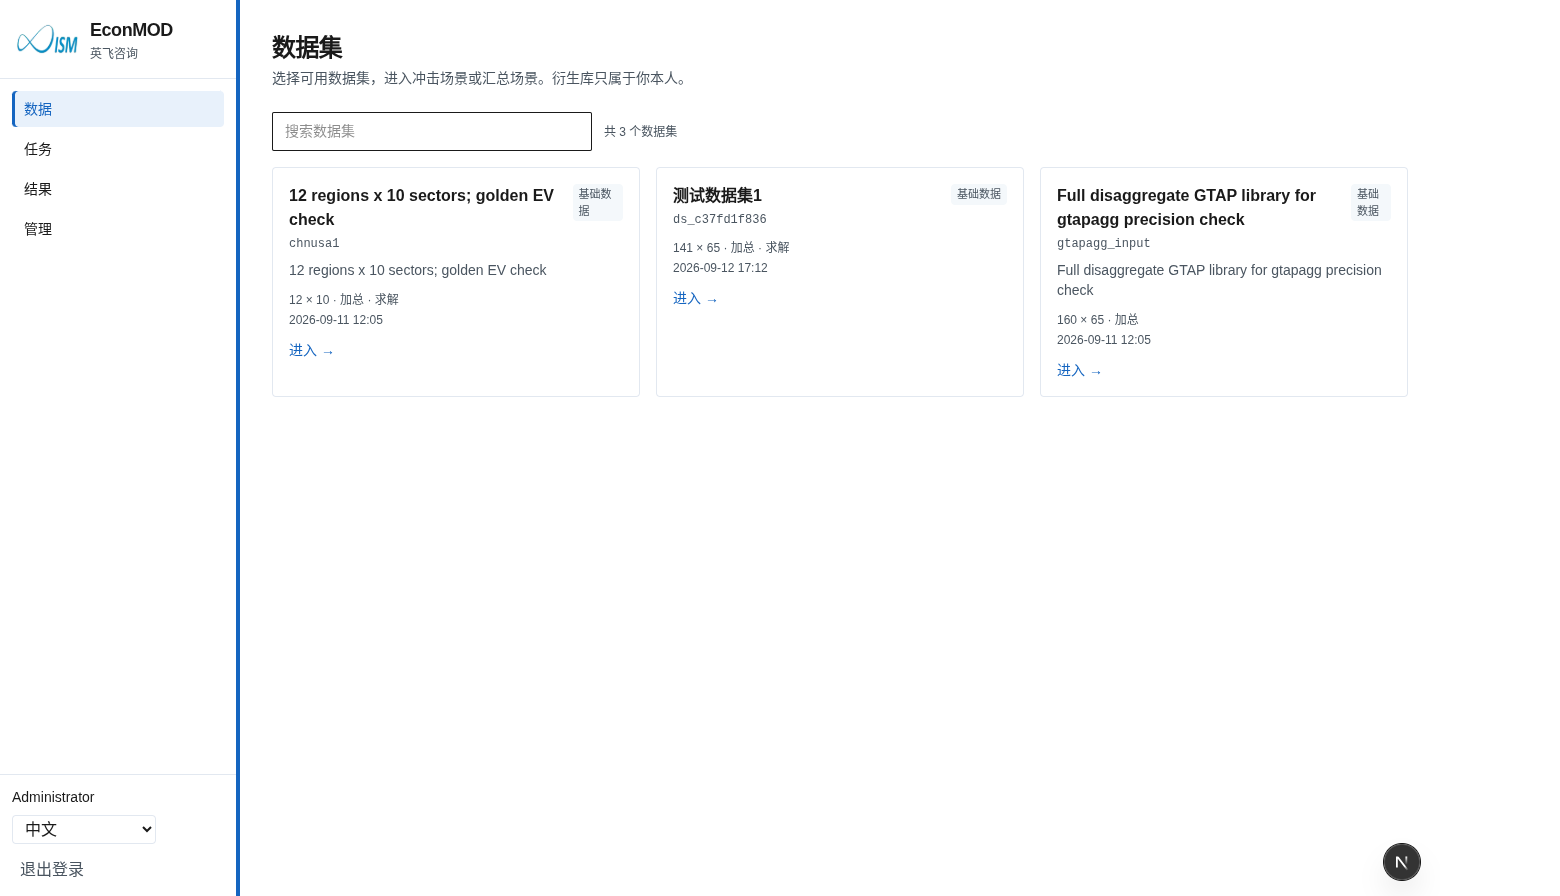
Data: licensed base libraries and scenario entry
Browse licensed base libraries in Data, filter by region × sector size, and enter a shock or aggregation scenario. Derived libraries belong to you alone.
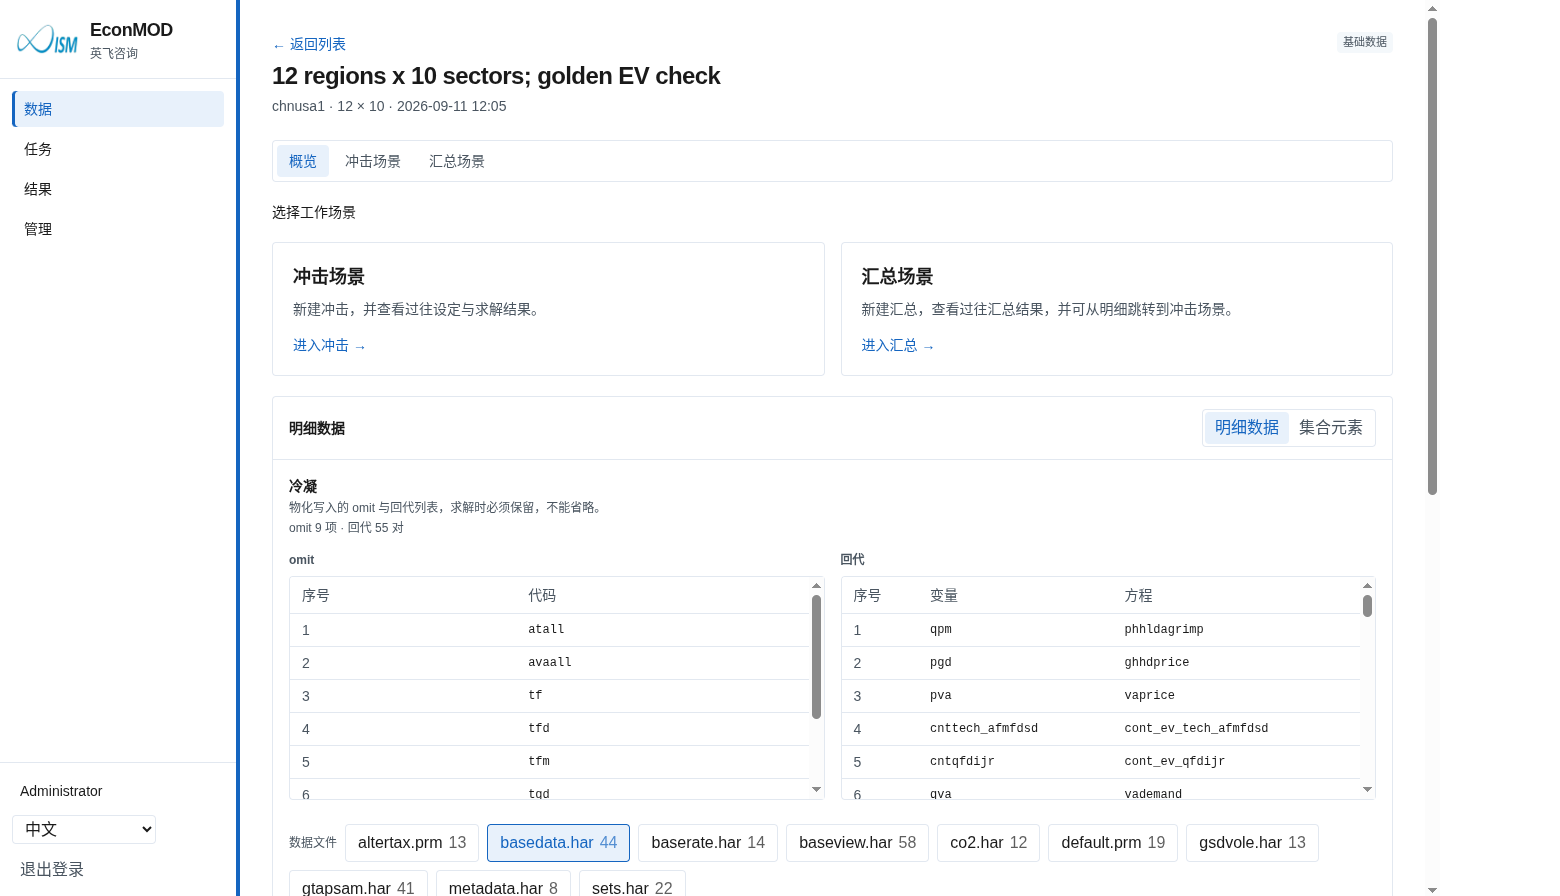
Inside a base library, the overview page offers two clear paths — Shock scenario and Aggregation scenario — plus detail data and condensing settings for verification.
Aggregation: region × sector mapping
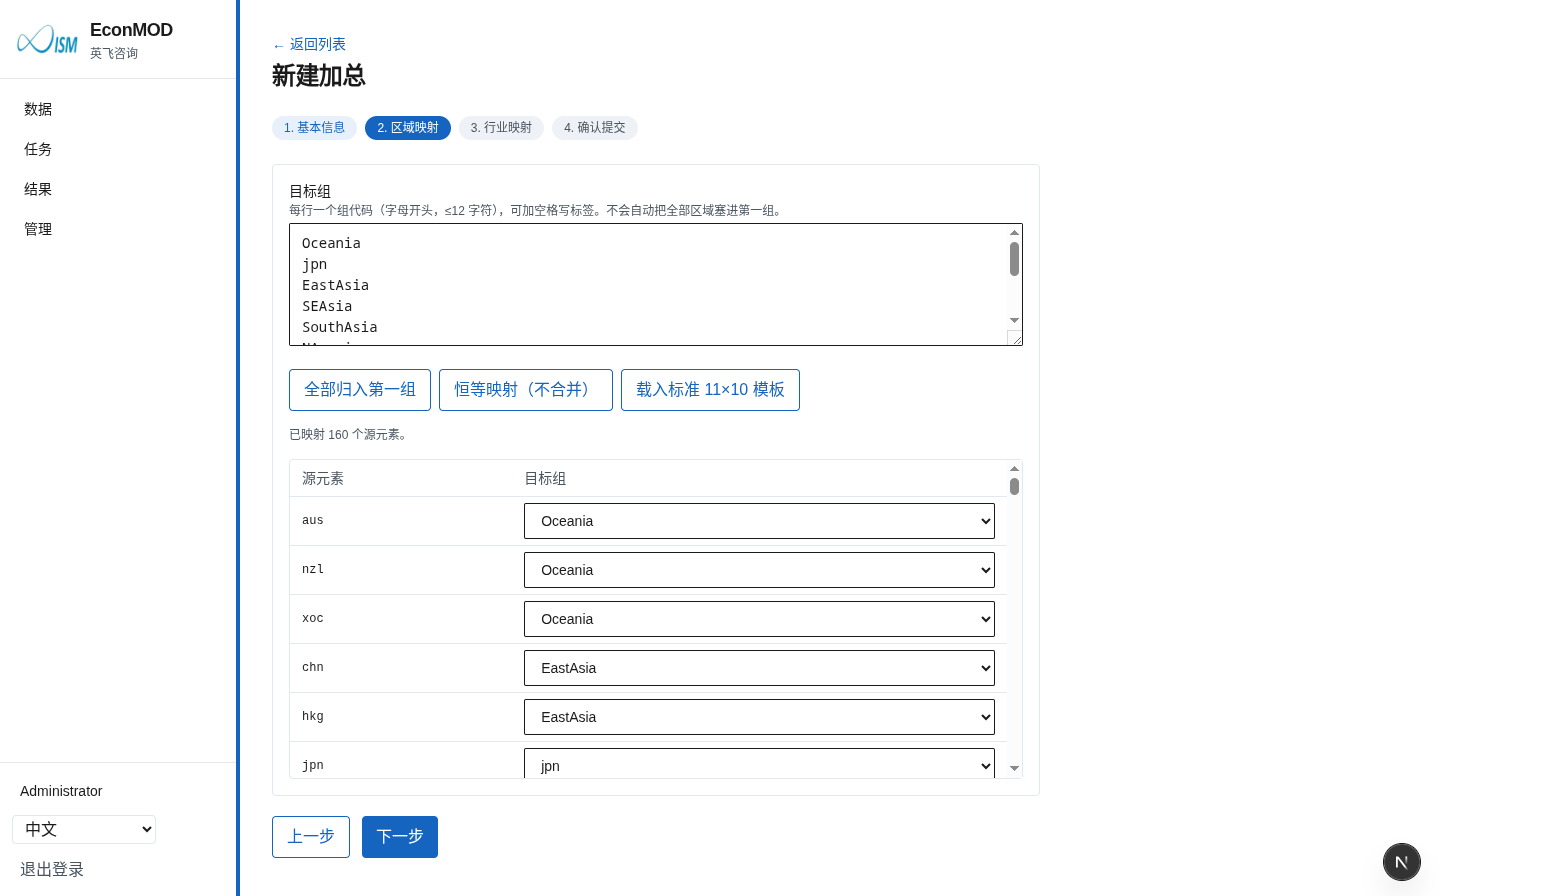
Creating a new aggregation uses a four-step wizard: basic info → region mapping → sector mapping → confirm and submit. Load the standard 11×10 template in one click, or assign each source element to a target group individually.
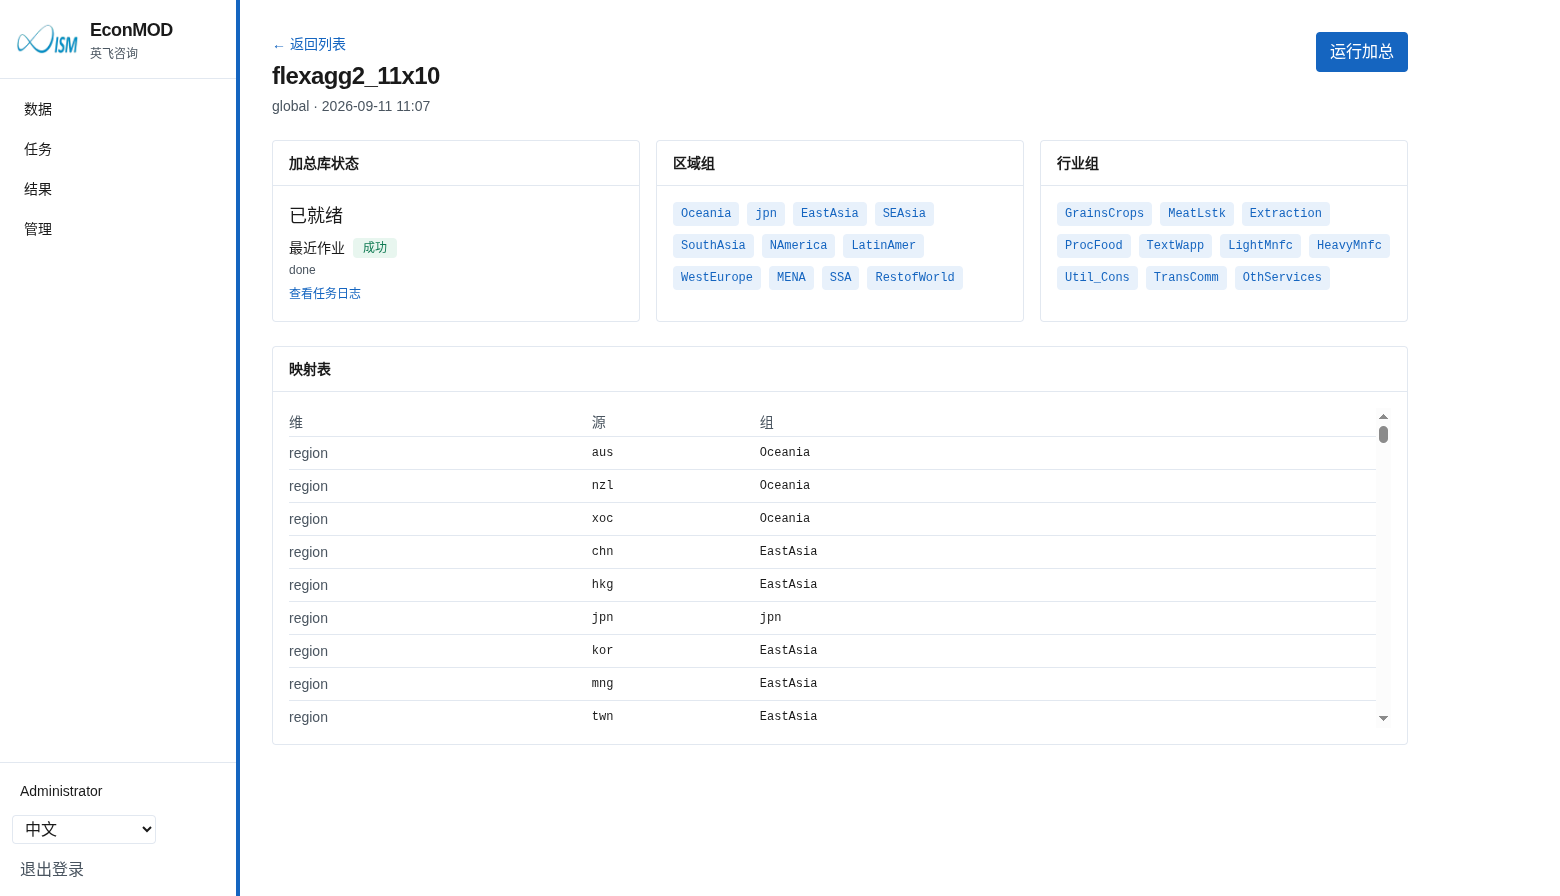
Once the aggregation scheme is saved, you can review region / sector groups, the full mapping table, and the aggregated-library status, and run the aggregation job in one click.
Closures & shocks: scenario setup
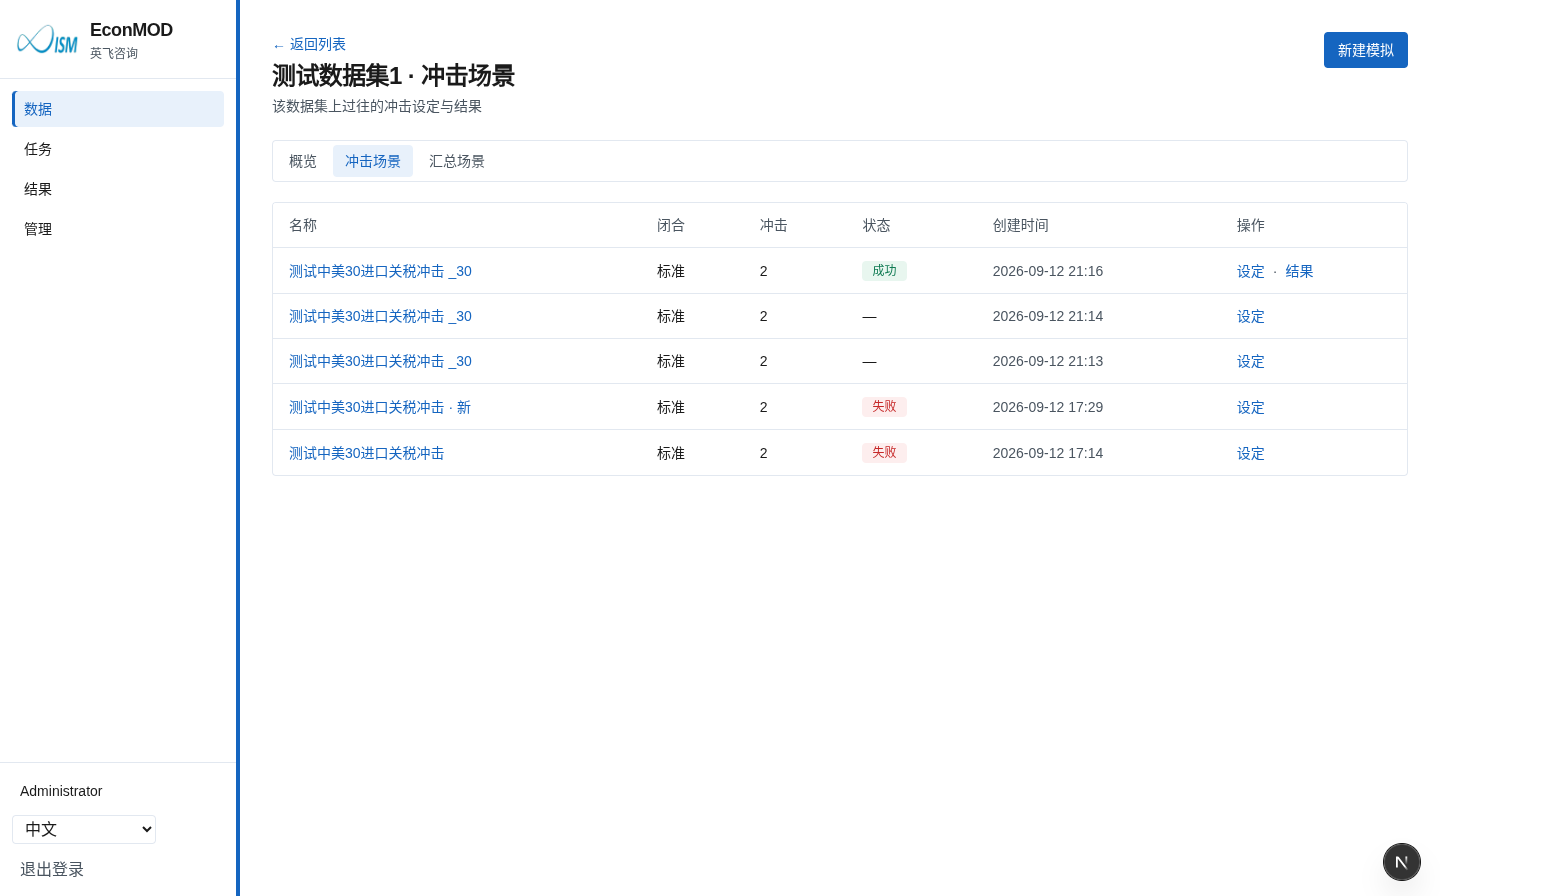
Manage past scenarios in the base library’s shock-scenario view: closure, number of shocks, and solve status at a glance, with jump links to setup or results.
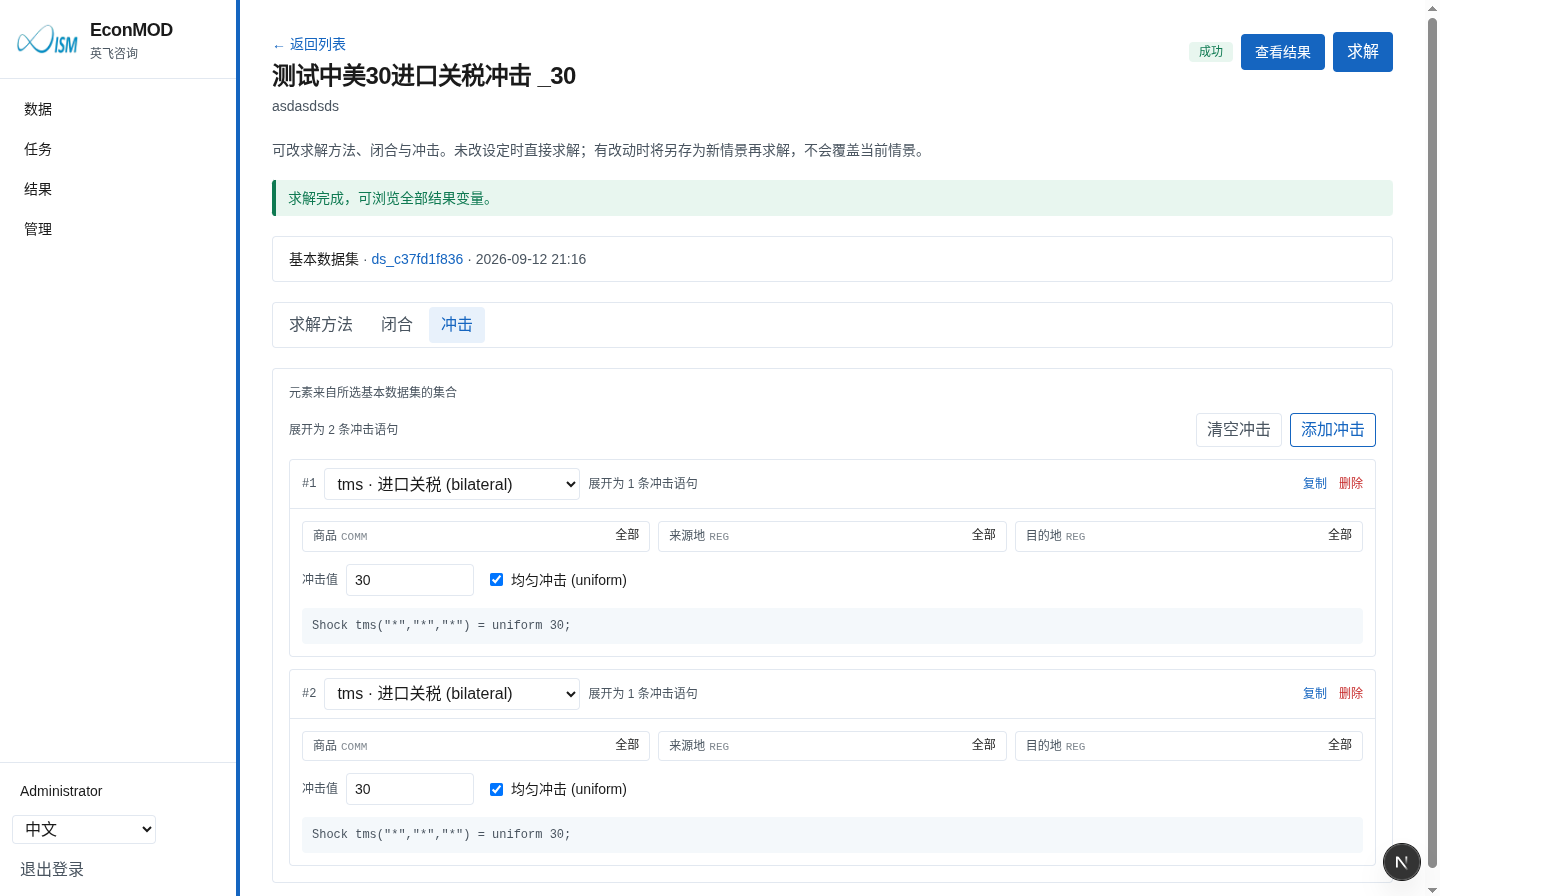
Inside a scenario, switch between Solve method / Closure / Shocks. Shocks support structured editing sliced over sets (e.g. bilateral import tariffs tms), with checkable shock statements generated; you can revise settings before re-solving.
Job center: queueing and logs
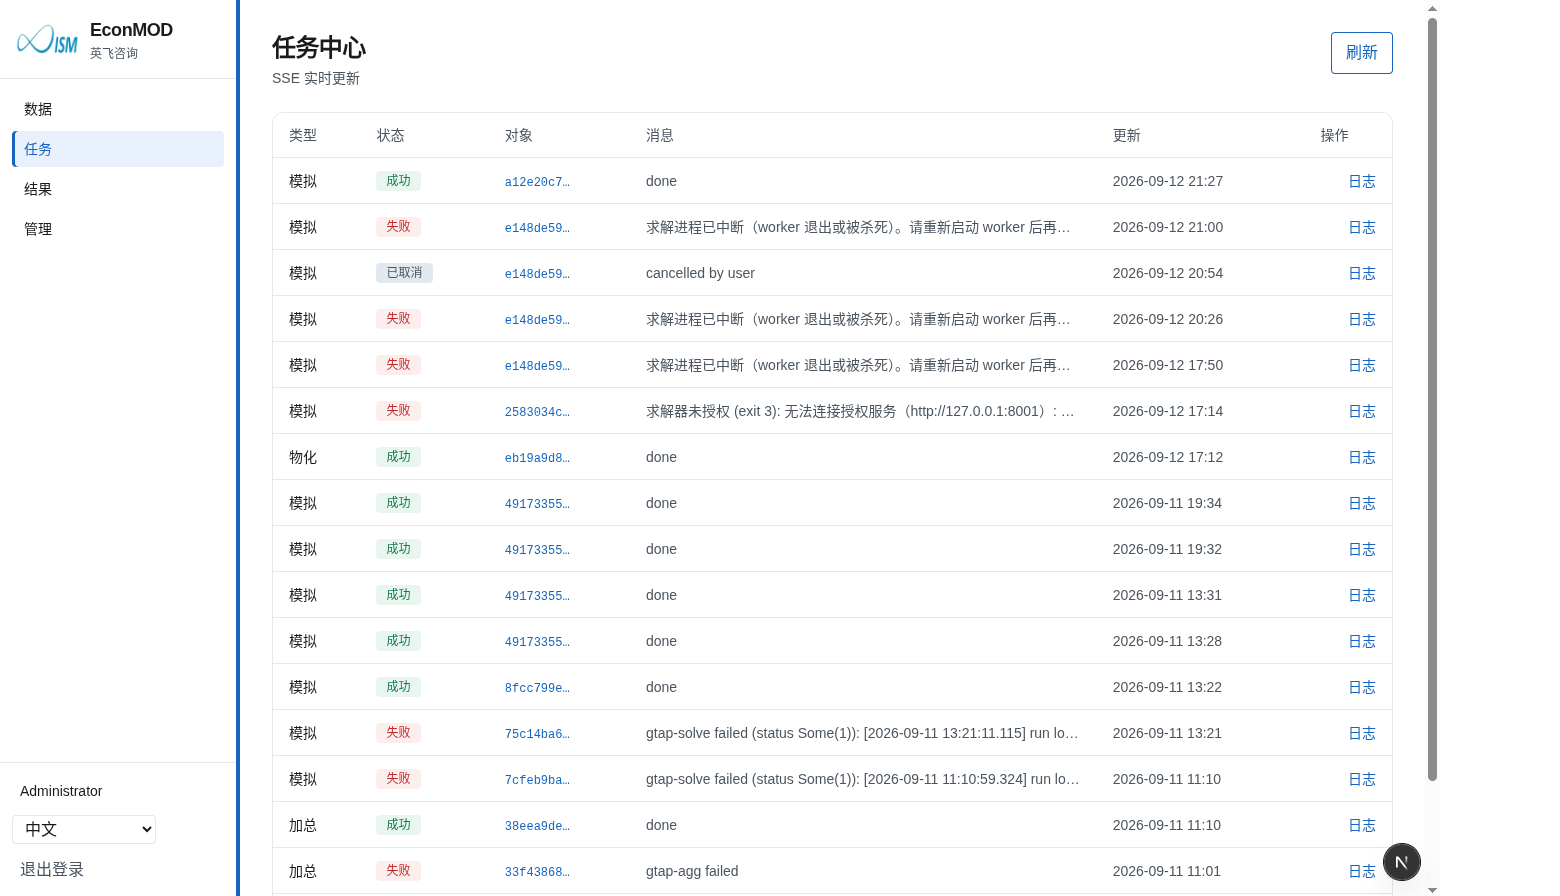
Aggregation, materialization and simulation jobs queue server-side; the Jobs page refreshes status in real time via SSE, with logs you can open for troubleshooting.
Results: search, browse, export
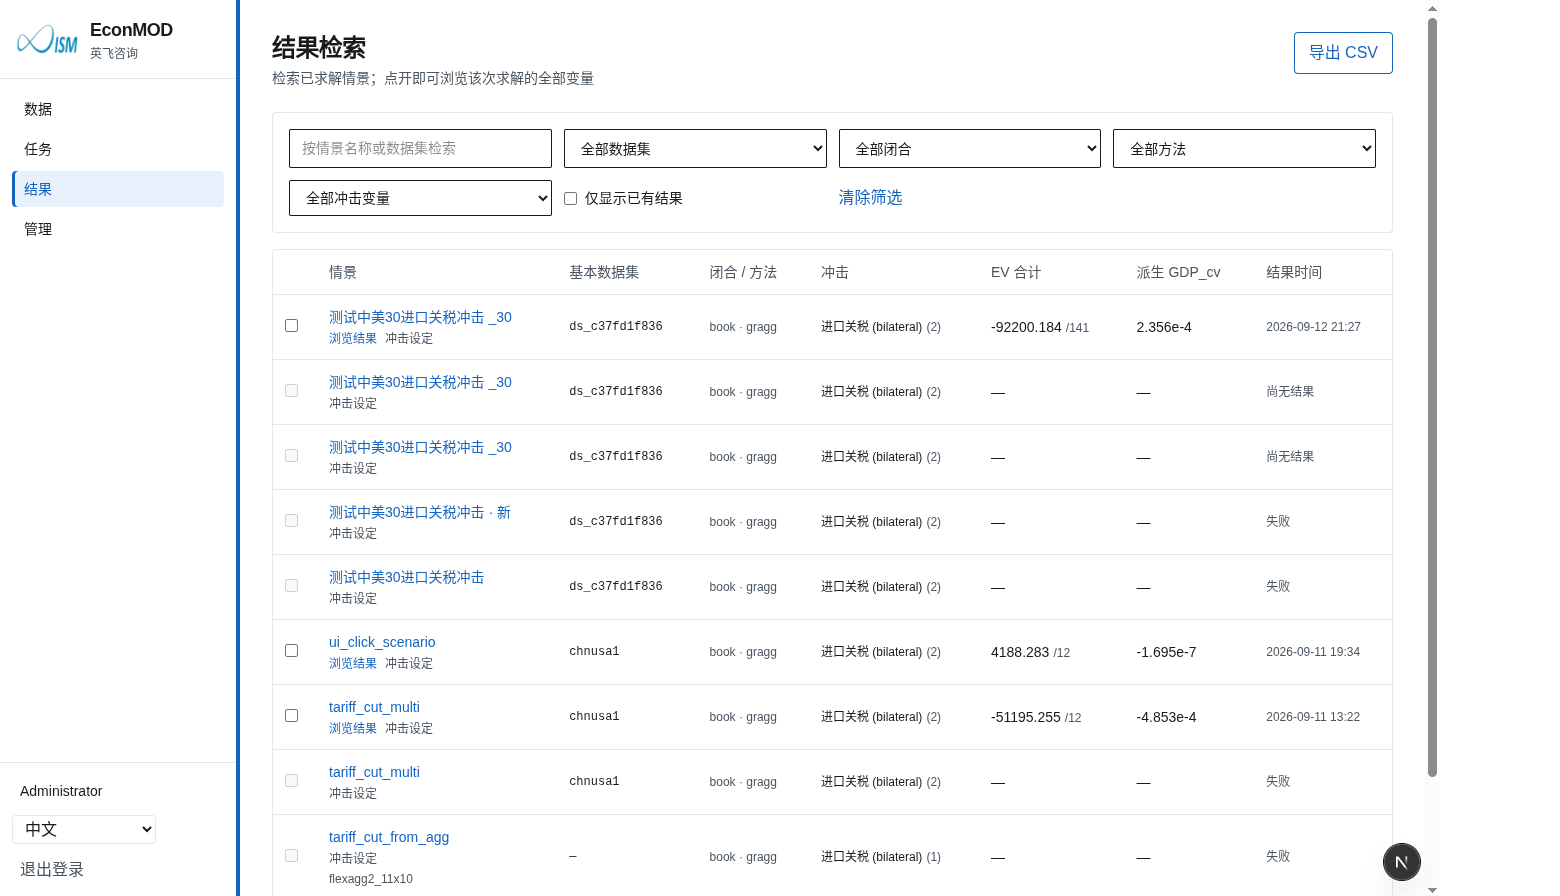
In Results, filter solved scenarios by dataset, closure, method and shock variable; compare EV / derived macro aggregates and export to CSV.
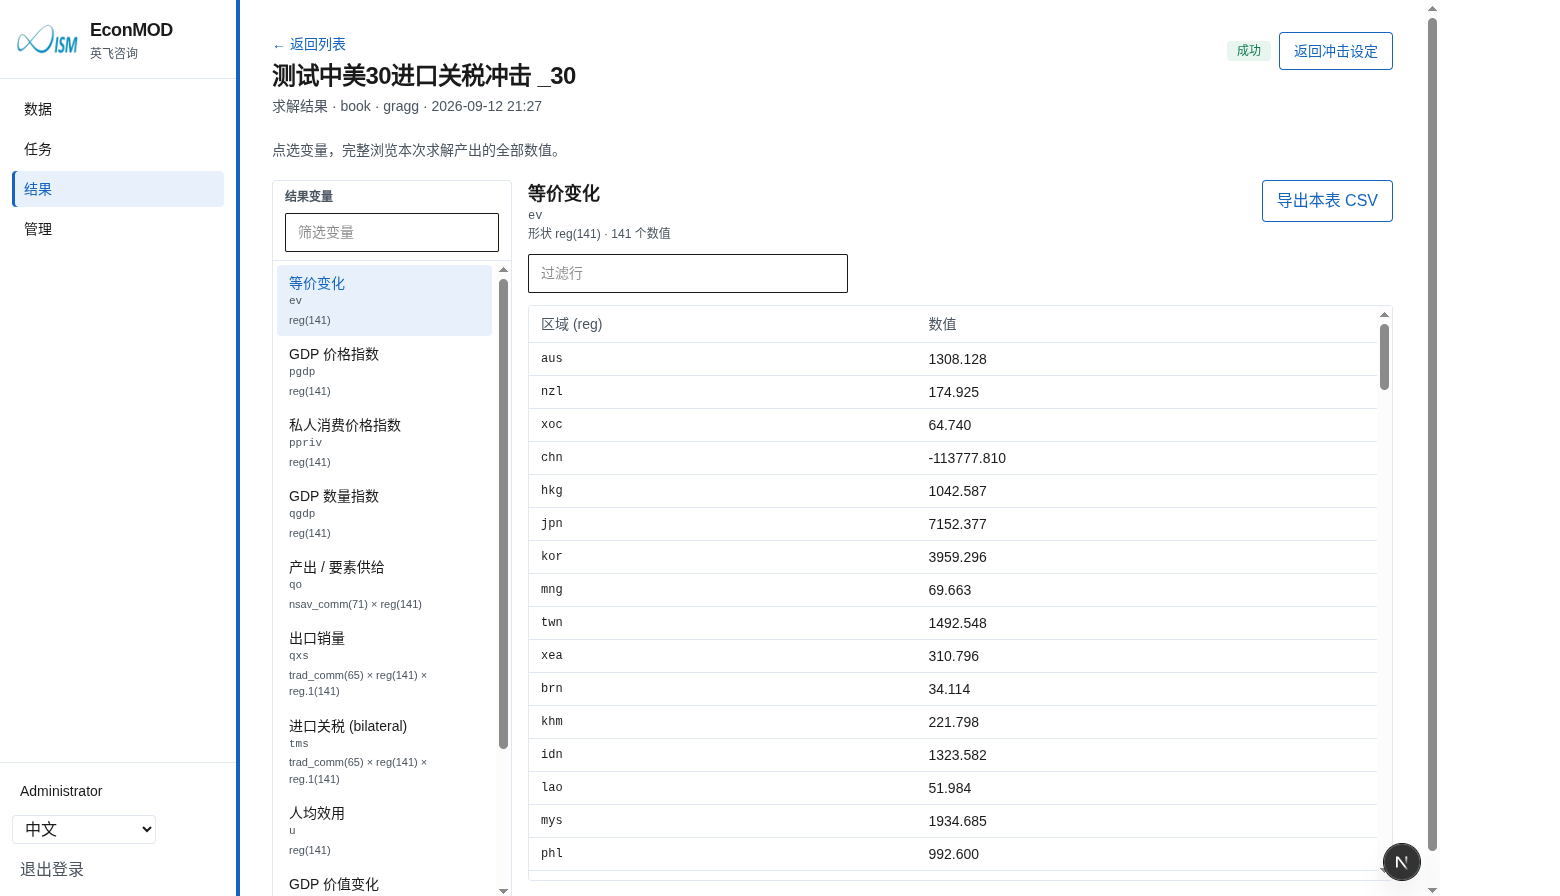
Open a solution: click a result variable on the left, browse the full slice of values on the right (e.g. regional welfare ev), and export the table.
Deep capabilities
Aggregation
Targeting GTAP-style base libraries, mapping is done by region × sector: group codes, labels, ordering and mapping completeness are validated before submission.
Full global mappings and standard compression templates (e.g. a teaching-scale 11×10) can all be saved as aggregation schemes — run an aggregation job in one click and jump straight to the shock scenarios on the derived library.
Closures & Shocks
Built-in Book / Short / Long / Self closure semantics, plus custom exogenous slices.
Shocks support uniform shocks and structured per-set editing, and can also be imported from text; a closure–shock pre-check runs before submission, cutting the cost of “ran for half an hour only to find the variable isn’t shockable”.
New scenarios can be created repeatedly on the same aggregated library — swap closure, swap shocks, swap solve step sizes — without redoing the dimension mapping every time.
Solve
The path methods economists already know are available directly:
- Gragg / Euler / Midpoint, with step-size sequences and Richardson extrapolation;
- Johansen linear one-step;
- Sub-interval iteration (iter) for large shocks.
Output is centered on structured results (welfare EV / global EV, derived macro aggregates, trade and prices, etc.), browsable variable by variable in the results page for easy team search and comparison.
Jobs & Governance
Aggregation and simulation jobs queue and run server-side; the interface tracks status and logs via the job center.
Administrators maintain base datasets, default authorizations and a bilingual variable dictionary — the whole team shares one “solvable source of truth”.
Who it’s for
- Applied CGE / GTAP analysts: fast iteration over tariff, productivity and trade-policy scenarios;
- Consulting and research teams: shared server compute and base-library licenses across multiple people, with auditable project outputs;
- Data and model administrators: publish base libraries, control the authorization surface, maintain variable glossaries.
If you’re still stitching directories together on a local machine, hand-editing scripts, and aligning closures with shocks manually, EconMOD’s value will be immediately obvious: it turns the reproducible modeling process into a product feature.
Quick start: from sign-in to results
Four steps to run a complete pipeline.
1. Sign in to the workbench
Open http://econmod.infsum.com/ and log in with your assigned account.
2. Pick a library and enter a scenario
In Data, choose an authorized base library → enter Aggregation scenario (mapping) or Shock scenario (closure / shocks / solve).
Aggregation path: load the standard template or a custom mapping → confirm and submit → run the aggregation.
Shock path: create or open a scenario → edit shocks and closure → solve.
3. Track jobs in the job center
After submitting, check queueing and status in Jobs; open the logs to diagnose failures.
4. Search and export in Results
Go to Results, search by scenario, open any solution to browse all variables, and export to CSV as needed.
Need an account or base-library authorization? Contact Infinite-Sum Consulting (Infinite-Sum Modeling).